Using Descriptive Statistics to Analyze Data in R
Enroll now →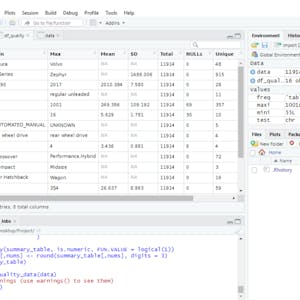
About this course
By the end of this project, you will create a data quality report file (exported to Excel in CSV format) from a dataset loaded in R, a free, open-source program that you can download. You will learn how to use the following descriptive statistical metrics in order to describe a dataset and how to calculate them in basic R with no additional libraries. - minimum value - maximum value - average value - standard deviation - total number of values - missing values - unique values - data types You will then learn how to record the statistical metrics for each column of a dataset using a custom function created by you in R. The output of the function will be a ready-to-use data quality report. Finally, you will learn how to export this report to an external file. A data quality report can be used to identify outliers, missing values, data types, anomalies, etc. that are present in your dataset. This is the first step to understand your dataset and let you plan what pre-processing steps are required to make your dataset ready for analysis. Note: This course works best for learners who are based in the North America region. We’re currently working on providing the same experience in other regions.
What you'll learn
- create a data quality report from a dataset
- calculate minimum, maximum, average, and standard deviation in R
- identify missing values and unique values in a dataset
- export reports to Excel in CSV format
Course objectives
- understand descriptive statistical metrics
- develop a custom function in R for analysis
- learn how to prepare data for further analysis
Skills you'll gain
Related courses

Data Science Foundations
USD 49

Data Analytics in the Public Sector with R
USD 49

Data Science as a Field
USD 99

Geographic Information Systems (GIS)
USD 49

Statistical Methods and Data Analysis
USD 49

Data Visualization & Analytics in Tableau
USD 49

Programming for Python Data Science: Principles to Practice
USD 49

Enhancing Reproducible Science with GitHub and Docker
USD 49
Course details are provided by the platform and may change — always confirm on the provider's site. Links may be affiliate links.